SECURITIES AND EXCHANGE COMMISSION
WASHINGTON, DCWashington, D.C. 20549
_________________
(RULE 14a-101)
_________________
SCHEDULE 14A INFORMATION
Securities
Exchange Act of 1934
Filed by a Party other than the Registrant¨
|
|
|
|
|
|
|
|
|
|
|
| |||
|
| |||
|
| |||
|
| |||
|
| |||
|
| |||
|
| |||
|
| |||
|
| |||
|
| |||
|
| |||
|
| |||
|
| |||

SECURITIES AND EXCHANGE COMMISSION
WASHINGTON, DCWashington, D.C. 20549
_________________
(RULE 14a-101)
_________________
SCHEDULE 14A INFORMATION
Exchange Act of 1934
Filed by a Party other than the Registrant¨
|
|
|
|
|
|
|
|
|
|
|
| |||
|
| |||
|
| |||
|
| |||
|
| |||
|
| |||
|
| |||
|
| |||
|
| |||
|
| |||
|
| |||
|
| |||
|
| |||
![[MISSING IMAGE: lg_lindblad.jpg]](https://capedge.com/proxy/DEF 14A/0001104659-20-053333/lg_lindblad.jpg)
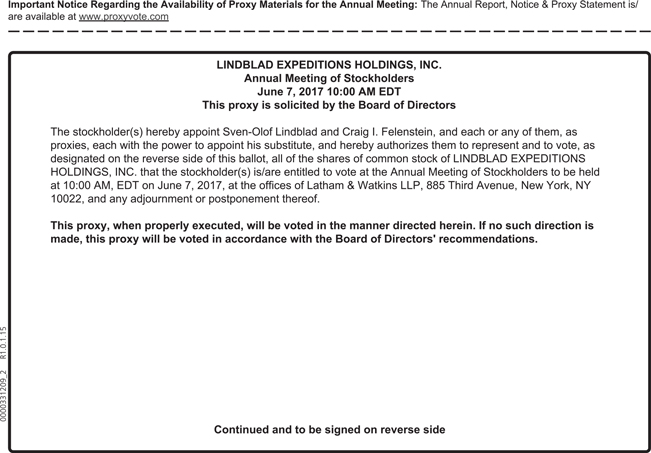
The 20172020 Annual Meeting of Stockholders of Lindblad Expeditions Holdings, Inc. will be held at the offices of Latham & Watkins LLP, 885 Third Avenue, New York, NY 10022,virtually on Wednesday June 7, 2017, beginning10, 2020 at 10:10:00 AAM EDT. Due to the emerging public health impact of the coronavirus outbreak (i.e., COVID-19) and to support the health and well-being of our stockholders and other stakeholders, we have decided that this year’s annual meeting will be a completely virtual meeting of stockholders, which will be conducted solely online via live webcast. You will be able to participate in the annual meeting online, vote your shares electronically and submit your questions prior to and during the meeting by visiting: .M. local time.http://www.viewproxy.com/Lindblad/2020/VM. You must enter the control number found on your proxy card, voting instruction form or notice you previously received. There is no physical location for the annual meeting. At the meeting, the holders of outstanding common stock will act on the following matters:
| | By Order of the Board of Directors, | | |
| | |||
/s/ Mark D. Ein | |||
Mark D. Ein | |||
| |
27, 2020
| | | | | 1 | | | |
| |
| | | 6 | | | |
| | | | | 7 | | | |
| | | | | 8 | | | |
| |
| | | 12 | | | |
| |
| | | 16 | | | |
| | | | | 17 | | | |
| |
| | | 30 | | | |
| |
| | | 31 | | | |
| |
| | | 32 | | | |
| | | | | 32 | | | |
| | | | | 33 | | | |
| |
| | | 33 | | | |
| | | | | 34 | | |
i
_________________
The Board of Directors of Lindblad Expeditions Holdings, Inc. (the “Company,” “we,” “us,” “our,” and “ours”) is soliciting proxies from its stockholders to be used at the 20172020 Annual Meeting of Stockholders to be held at the offices of Latham & Watkins LLP, 885 Third Avenue, New York, NY 10022virtually on Wednesday, June 7, 2017, beginning10, 2020 at 10:00 A.M. local time,AM EDT. Due to the emerging public health impact of the coronavirus outbreak (i.e., COVID-19) and at any postponementsto support the health and well-being of our stockholders and other stakeholders, we have decided that this year’s annual meeting will be a completely virtual meeting of stockholders, which will be conducted solely online via live webcast. You will be able to participate in the annual meeting online, vote your shares electronically and submit your questions prior to and during the meeting by visiting: http://www.viewproxy.com/Lindblad/2020/VM. You must enter the control number found on your proxy card, voting instruction form or adjournments thereof.notice you previously received. There is no physical location for the annual meeting. This proxy statement contains information related to the annual meeting.
materials.
The information in this
1
Only persons with evidence of stock ownership as
Cameras (including cell phones with photographic capabilities), recording devices and other electronic devices will not be permitted atyour proxy card, voting instruction form or notice you previously received. There is no physical location for the annual meeting.
or internet.
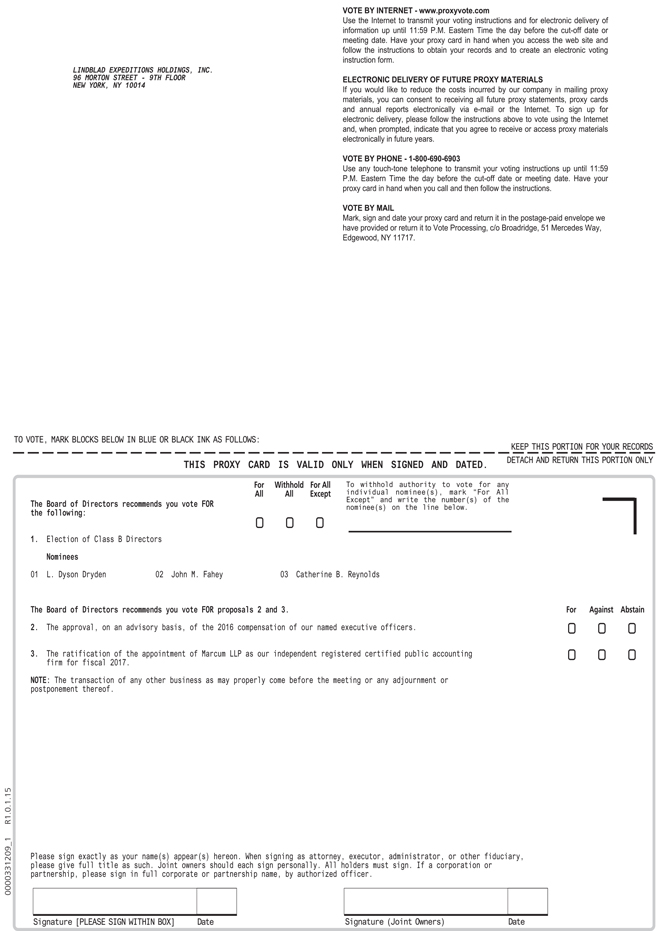
Your shares will be voted as you indicate. If you return the proxy card but you do not indicate your voting preferences, then your shares will not be voted with respect to any proposal other than the ratification of our auditors. The Board and management do not intend to present any matters at this time at the annual meeting other than those outlined in the notice of the annual meeting. Should any other matter requiring a vote of stockholders arise, stockholders returning the proxy card confer upon the individuals designated as proxies discretionary authority to vote the shares represented by such proxy on any such other matter in accordance with their best judgment.
2
internet.
Will stockholders be asked to vote on any other matters?
To the knowledge of the Company and its management, stockholders will vote only on the matters described in this proxy statement. However, if any other matters properly come before the meeting, the persons named as proxies for stockholders will vote on those matters in the manner they consider appropriate.
For the other proposals, you may vote “FOR,” “AGAINST” or “ABSTAIN.” Abstentions are considered to be present and entitled to vote at the meeting and, therefore, will have the effect of a vote against each of the proposals.
3
4
Name of Beneficial Owner |
| Number of |
| Percentage | |
Management and Directors: |
|
|
|
|
|
Sven-Olof Lindblad(2) |
| 13,394,277 |
| 29.7 | % |
Ian T. Rogers(3) |
| 1,106,334 |
| 2.5 | % |
Craig Felenstein(4) |
| 40,000 |
| * |
|
Philip Auerbach(5) |
| 90,000 |
| * |
|
Dean (Trey) Byus III(6) |
| 440,486 |
| 1.0 | % |
Richard P. Fontaine(7) |
| 5,000 |
| * |
|
J. Tyler Skarda(8) |
| 6,667 |
| * |
|
Benjamin L. Bressler(9) |
| 264,208 |
| * |
|
Mark D. Ein(10) |
| 7,475,859 |
| 15.2 | % |
L. Dyson Dryden(11) |
| 2,394,910 |
| 5.2 | % |
Bernard W. Aronson(12) |
| 14,768 |
| * |
|
Catherine Reynolds(13) |
| 9,972 |
| * |
|
Paul J. Brown(12) |
| 14,768 |
| * |
|
John M. Fahey(14) |
| 12,220 |
| * |
|
|
|
|
|
|
|
All directors and executive officers as a group (14 persons) |
| 25,269,469 |
| 50.1 | % |
|
|
|
|
|
|
5% Owners: |
|
|
|
|
|
Capitol Acquisition Management 2 LLC(10) |
| 7,475,859 |
| 15.2 | % |
Putnam Investments, LLC(15) |
| 2,350,733 |
| 5.2 | % |
Wellington Management Group LLP(16) |
| 4,524,896 |
| 10.0 | % |
T. Rowe Price Associates, Inc.(17) |
| 3,577,306 |
| 7.9 | % |
Talas Shipping GmbH & Co. KG and Two Mountain Ltd.(18) |
| 3,150,829 |
| 7.0 | % |
National Geographic Society(19) |
| 2,762,499 |
| 6.1 | % |
____________
| Name of Beneficial Owner | | | Number of Shares Beneficially Owned | | | Percentage Beneficially Owned(1) | | ||||||
| Management and Directors: | | | | | | | | | | | | | |
Sven-Olof Lindblad(2) | | | | | 12,525,347 | | | | | | 25.1% | | |
Craig Felenstein(3) | | | | | 202,230 | | | | | | * | | |
Philip Auerbach(4) | | | | | 93,194 | | | | | | * | | |
Dean (Trey) Byus III(5) | | | | | 123,612 | | | | | | * | | |
| Benjamin L. Bressler | | | | | 86,555 | | | | | | * | | |
Mark D. Ein(6) | | | | | 5,013,833 | | | | | | 10.1% | | |
L. Dyson Dryden(7) | | | | | 1,179,969 | | | | | | 2.4% | | |
Bernard W. Aronson(7) | | | | | 29,035 | | | | | | * | | |
Catherine Reynolds(7) | | | | | 24,239 | | | | | | * | | |
Elliott Bisnow(8) | | | | | 25,319 | | | | | | * | | |
John M. Fahey(7) | | | | | 83,035 | | | | | | * | | |
Daniel J. Hanrahan(9) | | | | | 26,146 | | | | | | * | | |
Sarah Farrell(10) | | | | | — | | | | | | * | | |
| Thomas S. (Tad) Smith Jr. | | | | | — | | | | | | * | | |
| All directors and executive officers as a group (14 persons) | | | | | 19,384,850 | | | | | | 38.9% | | |
| 5% Owners: | | | | | | | | | | | | | |
Capitol Acquisition Management 2 LLC(6) | | | | | 5,013,833 | | | | | | 10.1% | | |
ValueAct Capital(10) | | | | | 4,923,247 | | | | | | 9.9% | | |
5
targets and continued service on the vesting date.
(4) Includes 40,000 shares of restricted stock that vest in equal installments on each of September 6, 2017, 2018, 2019 and 2020. Excludes (i) options to purchase 200,000 shares of our common stock vesting annually pro rata over a four-year period beginning on September 6, 2017, (ii) 22,321 restricted stock units that vest in three annual installments beginning on April 3, 2018, and (iii) 22,321 performance share units that will vest, if at all, after a three-year performance period (and may be earned at a level ranging from 0% to 200%).
(5) Includes 90,000 shares of restricted stock that vest in equal installments on each of May 26, 2017, 2018, 2019 and 2020. Excludes (i) 22,321 restricted stock units that vest in three annual installments beginning on April 3, 2018, and (iii) 22,321 performance share units that will vest, if at all, after a three-year performance period (and may be earned at a level ranging from 0% to 200%).
(6) Includes 143,314 options to purchase shares of our common stock for $1.76 per share that vested on December 31, 2016. Excludes (i) options to purchase 238,856 shares of our common stock that vest on December 31, 2017; (ii) 15,346 restricted stock units that vest in three annual installments beginning on April 3, 2018 and (iii) 15,346 performance share units that will vest, if at all, after a three-year performance period (and may be earned at a level ranging from 0% to 200%).
(7)Includes 5,000 shares of restricted stock granted on January 10, 2017 as part of the 2016 CEO Allocation Plan, of which 1,667 shares vested immediately on January 10, 2017, and the remaining shares vest in equal installments on each of January 10, 2018 and 2019. Excludes 1,726 restricted stock units that vest in three annual installments beginning on April 3, 2018.
(8) Includes 6,667 options to purchase common stock for $11.26 per shares that vested on January 4, 2017. Excludes (i) options to purchase 13,333 shares for $11.26 per share vesting 50% on each of January 4, 2018March 29, 2021 and 2019,2022, and (ii) 6,975 restricted stock units12,350 unvested RSUs that vest in three annual installments beginningfull on March 30, 2021, subject to continued service on the vesting date, and 18,048 unvested PSUs that vest in full on March 30, 2021, 13,092 unvested PSUs that vest in full on March 29, 2022 and 12,350 unvested PSUs that vest in full on March 31, 2023, subject to achieving performance targets and continued service on the vesting date. Includes 22,500 shares of unvested restricted stock that will vest within 60 days of April 3, 2018.
(9) 16, 2020, on May 26, 2019, subject to continued service on the vesting date.
(10) Representsheld directly by Mr. Ein and 4,769,086 shares held by Capitol Acquisition Management 2 LLC, of which Leland Investments Inc., an entity controlled by Mr. Ein, is the sole member. As a result, Mr. Ein has voting and dispositive control over such shares. Includes 4,004,675 warrants and 93,417Excludes 6,348 shares of incentive commonrestricted stock held by Mr. Ein that vests in full on August 8, 2020, subject to forfeiture if our common stock does not trade above $13.00 per share for any 20 trading days during any 30-day period until July 8, 2019, which will be contributed to National Geographic forcontinued service on the purpose of the Lindblad Expeditions — National Geographic Joint Fund for Exploration and Conservation (“LEX-NG Fund”), for no additional consideration, within three business days after their release from escrow in connection with the lapse of such forfeiture conditions. Also includes 4,440vesting date.
(11) Includes 1,334,891 warrants and 28,250 shares of incentive common stock, subject to forfeiture if our common stock does not trade above $13.00 per share for any 20 trading days during any 30-day period until July 8, 2019, which will be contributed to National Geographic for the purpose of the LEX-NG Fund, for no additional consideration, within three business days after their release from escrow in connection with the lapse of such forfeiture conditions. Also includes 4,4402,397 shares of restricted stock that vestvests in equal installmentsfull on each of August 8, 2017 and 2018 and 8,108 shares of restricted stock that vest in equal installments2020, subject to continued service on each of August 8, 2017, 2018 and 2019.
(12) Includes 4,440 shares of restricted stock that vest in equal installments on each of August 8, 2017 and 2018 and 8,108 shares of restricted stock that vest in equal installments on each of August 8, 2017, 2018 and 2019.
(13) Includes 1,243 shares of restricted stock that vest in equal installments on each of August 8, 2017 and 2018 and 8,108 shares of restricted stock that vest in equal installments on each of August 8, 2017, 2018 and 2019.
the vesting date.
(15)
(16) Information from Schedule 13G/A filed on February 9, 2017 by Wellington Management Group LLP, Wellington Group Holdings LLP, Wellington Investment Advisors Holdings LLP and Wellington Management Company LLP. EachLetterman Drive, Building D, Fourth Floor, San Francisco, CA 94129. Ms. Farrell is an associate of the entities reported shared voting power over 3,726,235 shares and shared dispositive power over 4,524,896 shares other than Wellington Management Company LLP who reported shared voting power over 3,719,231 shares and shared dispositive power over 4,168,542 shares. The address of the reporting entities is c/o Wellington Management Company LLP, 280 Congress Street, Boston, MA 02210.
(17) Information from Schedule 13G/A filed on February 7, 2017 by T. Rowe Price Associates, Inc. and T. Rowe Price New Horizons Funds, Inc. T. Rowe Price Associates, Inc. reported sole voting power over 551,005 shares and sole dispositive
6
power over 3,577,306 shares. T. Rowe Price New Horizons Funds, Inc. reported sole voting power over 3,026,301 shares. The address of the reporting entities is 100 E. Pratt Street, Baltimore, MD 21202.
(18) Information from Schedule 13G/A filed on February 14, 2017 by Talas Shipping GmbH & Co. KG (“Talas”), Two Mountain Ltd. (“Two Mountain”), Johann Killinger (“Dr. Killinger”) and Dirk Baldeweg (“Dr. Baldeweg”). Each of Dr. Killinger and Dr. Baldeweg serve as managing director to Talas and director to Two Mountain. Each of Dr. Killinger and Dr. Baldeweg may be deemed the beneficial owner of (i) 1,136,587 shares beneficially owned by Talas and (ii) 2,014,242 shares beneficially owned by Two Mountain. The address of the reporting entities is Schlossstrasse 5, 23883 Seedorf, Germany.
(19) The extension of our Alliance and License Agreement and Tour Operator Agreement between us and National Geographic was contingent on the execution by Mr. Lindblad of a call option agreement granting National Geographic the right to purchase 2,387,499 of Mr. Lindblad’s shares in the Company for a per share price of $10.00 per share. The amount of common stock expected to be beneficially owned by National Geographic assumes the exercise of this call option by National Geographic. The amount beneficially owned also includes 375,000 shares contributed to National Geographic, for no additional consideration, for the purpose of the LEX-NG Fund and excludes 125,000 shares that will be contributed to National Geographic, for no additional consideration, by Mr. Ein, Mr. Dryden and the other initial stockholders for the purpose of the LEX-NG Fund if our common stock trades above $13.00 per share for any 20 trading days during any 30-day period until July 8, 2019. The business address of National Geographic is 1145 17th Street NW, Washington, DC 20036. Assuming National Geographic exercises its option to acquire shares of our common stock, Gary E. Knell will have dispositive and/or voting power with respect to such shares by reason of his status as President and Chief Executive Officer of National Geographic. Mr. Knell disclaims beneficial ownership of any shares of our common stock owned or acquired by National Geographic.
ValueAct Capital.
met on a timely basis other than an inadvertent late Form 4 filed by Mr. Auerbach with respect to the disposition of shares to the Company for taxes upon vesting of an equity award.
ten.
All of our director nominees are currently serving as a director.
8
his bachelor’s degree in engineering from Manhattan College and his master’s degree in business administration from the University of Michigan. In 2008, he received the David D. Alger Alumni Achievement Award from the University of Michigan’s Ross School of Business.
9
United Nations Foundation’s Global Entrepreneurs Council.
hospitality sectors. He most recently served as the President, Chief Executive Officer and Director of Regis Corporation, a global leader in beauty salons and cosmetology, from 2012 to 2017. Prior to joining Regis Corporation, from 2007 to 2012, he was President and CEO of Celebrity Cruises, a cruise line and division of Royal Caribbean Cruises Ltd. His distinguished career has also included executive-level positions with Polaroid Corporation and Reebok International Ltd. Since 2012, Mr. Hanrahan has served as a Director of Cedar Fair, L.P., a leader in regional amusement parks, water parks and active entertainment, and is the Chairman of the Board. Mr. Hanrahan joined the board of Foss Swim Schools, a Prairie Capital company, in April 2019. In 2004, he was named one of the “Top 25 Extraordinary Minds in Hospitality Sales and Marketing” by Hospitality and Sales Marketing Association International. He received a Bachelor’s of Business Administration degree from the University of Wisconsin.
10
adventure travel.
11
| Name | | | Audit Committee | | | Compensation Committee | | | Nominating Committee | | |||||||||
| Mr. Aronson | | | | | — | | | | | | — | | | | | | M | | |
| Mr. Bisnow | | | | | — | | | | | | — | | | | | | — | | |
| Mr. Dryden | | | | | C | | | | | | M | | | | | | — | | |
| Mr. Ein | | | | | M | | | | | | M | | | | | | C | | |
| Mr. Fahey | | | | | — | | | | | | C | | | | | | M | | |
| Ms. Farrell | | | | | — | | | | | | — | | | | | | — | | |
| Mr. Hanrahan | | | | | M | | | | | | — | | | | | | — | | |
| Ms. Reynolds | | | | | — | | | | | | M | | | | | | — | | |
| Mr. Smith | | | | | — | | | | | | — | | | | | | — | | |
The nominating committee consists of Messrs. Ein, Fahey and Brown, with Mr. Ein serving as Chairman.
in February 2020 for the 2019 year.
•
The audit committee consists of Messrs. Dryden, Brown and Ein, with Mr. Dryden serving as Chairman.
12
Financial Experts on Audit Committee. The audit committee will at all times be composed exclusively of “independent directors,” as defined for audit committee members under the Nasdaq listing standards and the rules and regulations of the Securities and Exchange Commission, who are “financially literate,” as defined under Nasdaq’s listing standards. Nasdaq’s listing standards define “financially literate” as being able to read and understand fundamental financial statements, including a company’s balance sheet, income statement and cash flow statement. The Board of Directors has determined that each of Messrs. Dryden, Brown and Ein satisfy Nasdaq’s definition of financial sophistication and also will qualify as an “audit committee financial expert” as defined under rules and regulations of the Securities and Exchange Commission.
The compensation committee consists of Messrs. Fahey, Dryden and Ein and Ms. Reynolds, with Mr. Fahey serving as Chairman.
The processes for consideration of executive compensation are discussed further under “Executive Compensation — Compensation Discussion and Analysis.”
13
on eachthe first anniversary of August 8, 2017, 2018 and 2019.the grant date, subject to continued service with us. We have also established a deferred compensation program for our non-employee directors to elect to defer receipt of their director compensation.
Name |
| Fees Earned or |
| Option |
| Stock |
| All Other |
| Total | |||||
Mark D. Ein |
| $ | 50,000 |
| $ | — |
| $ | 150,000 |
| $ | — |
| $ | 200,000 |
Bernard W. Aronson |
| $ | 50,000 |
| $ | — |
| $ | 150,000 |
| $ | — |
| $ | 200,000 |
Paul J. Brown |
| $ | 50,000 |
| $ | — |
| $ | 150,000 |
| $ | — |
| $ | 200,000 |
L. Dyson Dryden |
| $ | 50,000 |
| $ | — |
| $ | 150,000 |
| $ | — |
| $ | 200,000 |
John M. Fahey(2) |
| $ | 50,000 |
| $ | — |
| $ | 150,000 |
| $ | — |
| $ | 200,000 |
Catherine B. Reynolds(3) |
| $ | 32,830 |
| $ | — |
| $ | 93,751 |
| $ | — |
| $ | 126,581 |
____________
| Name | | | Fees Earned or Paid in Cash | | | Option Awards | | | Stock Awards(1) | | | All Other Compensation | | | Total | | |||||||||||||||
Mark D. Ein(2) | | | | $ | 63,750 | | | | | $ | — | | | | | $ | 74,990 | | | | | $ | — | | | | | $ | 138,740 | | |
| Bernard W. Aronson | | | | $ | 51,250 | | | | | $ | — | | | | | $ | 74,990 | | | | | $ | — | | | | | $ | 126,240 | | |
| Elliott Bisnow | | | | $ | 51,250 | | | | | $ | — | | | | | $ | 74,990 | | | | | $ | — | | | | | $ | 126,240 | | |
| Daniel J. Hanrahan | | | | $ | 51,250 | | | | | $ | — | | | | | $ | 74,990 | | | | | $ | — | | | | | $ | 126,240 | | |
L. Dyson Dryden(3) | | | | $ | 55,000 | | | | | $ | — | | | | | $ | 74,990 | | | | | $ | — | | | | | $ | 129,990 | | |
John M. Fahey(4) | | | | $ | 53,750 | | | | | $ | — | | | | | $ | 74,990 | | | | | $ | — | | | | | $ | 128,740 | | |
| Catherine B. Reynolds | | | | $ | 51,250 | | | | | $ | — | | | | | $ | 74,990 | | | | | $ | — | | | | | $ | 126,240 | | |
(2) Stock The 2019 stock awards consistwere issued prior to the revised non-employee director compensation plan being adopted.
(3) Appointed$10,000 for serving as a director on May 5, 2016.
14
Chairman of the Board of Directors and $2,500 for serving as the chairman of the Nomination Committee during 2019.
Name | |
| Age | | | Position | |
Sven-Olof Lindblad | |
| 69 | | | Chief Executive Officer, President and Director | |
|
|
| |||||
Craig I. Felenstein | |
| 47 | | | Chief Financial Officer | |
Philip J. Auerbach | | | 40 | | | Chief Commercial Officer | |
| Dean (Trey) Byus III | |
| 51 | | | Chief Expedition Officer | |
|
|
| |||||
|
|
| |||||
|
|
| |||||
Benjamin L. Bressler | |
| 57 | | | President, Natural Habitat, Inc. | |
Ian T. Rogers joined Lindblad in the spring of 2009 as its Chief Financial Officer and Treasurer and in 2014, his role expanded to also include the positions of Vice President and Chief Operating Officer. In connection with the hiring of a separate Chief Financial Officer in November 2015, Mr. Rogers ceased serving as our Chief Financial Officer at such time. During 2008, Mr. Rogers served as an independent financial consultant to Lindblad. Mr. Rogers served as Chief Financial Officer for E Suites Hotels, LLC from 2007 to 2008 and was Chief Financial Officer of Tauck World Discovery from 2006 to 2007. From 1992 to 2006, Mr. Rogers was Senior Director of Finance, Vice President of Finance and Divisional CFO of Carlson Hotels Worldwide (Carlson Companies). Mr. Rogers has broad experience in hotel, travel, leisure, and cruise businesses in the U.S., Eastern Europe, the Caribbean and the Middle East. Mr. Rogers holds an M.B.A. from the University of Minnesota and a B.S. in Hospitality Management from the University of Bournemouth, UK.
Philip J. Auerbach joined us as Chief Commercial Officer in May 2016. Mr. Auerbach has served as Senior Vice President and Regional Chief Marketing Officer of Caesars Entertainment Corporation, a leading entertainment and hospitality company, since July 2013. From July 2007 to July 2013, Mr. Auerbach was a partner in the marketing and sales practice of McKinsey & Co., counseling clients across the financial services, hospitality, airline, and telecommunications industries. From March 2002 to April 2007, he served as a principal at Novantas, Inc., a boutique financial services consulting group. Mr. Auerbach holds a B.S. in Hospitality Management from Cornell University.
15
Richard P. Fontaine joined Lindblad as Chief Marketing Officer in July 2013, and oversees all marketing and sales initiatives, including public relations, communications and corporate brand positioning efforts. Mr. Fontaine brings more than 25 years of experience in consumer-direct marketing for highly-regarded lifestyle media and merchandising brands. From February 1997 until July 2013, Mr. Fontaine served as SVP, Consumer Marketing for Martha Stewart Living Omnimedia, Inc. Previously, Mr. Fontaine served in product management/marketing roles at Time Inc./Sports Illustrated, and MBI, Inc./The Danbury Mint. Mr. Fontaine holds a B.A. in Economics from Cornell University.
J. Tyler Skarda joined us as Senior Vice President, Marine Operations in January 2016 and oversees our marine operations and marine fixed assets. Mr. Skarda brings over two decades of maritime industry experience, focused on strategy, capital equipment procurement cost reduction, and shipbuilding/ship operations process improvement for global maritime companies and their suppliers. Prior to joining us, Mr. Skarda served as a consultant with the leading global management consulting firm, A.T. Kearney. Mr. Skarda started his career in the United States Navy and later worked in the Office of the Secretary of Defense as a senior maritime industry analyst prior to leaving the service. Mr. Skarda holds a B.S. in electrical engineering from California State University, Sacramento and an M.B.A. from the Fuqua School of Business at Duke University.
16
In light
ongoing engagement with our stockholders on executive compensation practices. The compensation committee specifically considers the results from the annual stockholder advisory vote on executive compensation. At the 2019 annual meeting of shareholders, more than 99% of the votes cast on the stockholder advisory vote on executive compensation were in favor of our executive compensation.
Our Board of Directors, our compensation committee and our Chief Executive Officer will each play a role in setting the compensation of our NEOs. Our Board of Directors appoints the members of our compensation committee and delegates to the compensation committee the direct responsibility for overseeing the design and administration of our executive compensation program.
In setting The committee evaluates the performance of the CEO and determines his compensation our compensation committee (or, withbased on this evaluation. With respect to certain performance-based compensation opportunities, a subcommittee thereof) will consider the deductibility of compensation under the Internal Revenue Code. Section 162(m) of the Internal Revenue Code generally prohibits publicly traded companies from taking a tax deduction for compensation in excess of $1.0 million that is paid to the chief executive officer andour other executive officers, excluding the chief financial officer. However,committee considers the CEO’s input as to performance evaluations and recommended compensation thatarrangements. The compensation of all named executive officers is considered “performance-based” compensation under Section 162(m) is not subject to the $1.0 million limit on deductibility. The compensation committee will considerfinal approval of the deductibility of performance-based compensation under Section 162(m) in setting compensation for executive officers, but it may approve compensation that will not meet the requirements of Section 162(m) in order to ensure competitive compensation levels and structures for executive officers or for other reasons. In addition, notwithstanding intentions, because of ambiguities and uncertainties as to the application and interpretation of Section 162(m)committee.
For fiscaldetermine competitive pay levels, evaluate pay program design, and assess evolving technical constraints. In 2016, the compensation committee retained the firm of Frederic W. Cook & Co. (“FW Cook”) to provide assistance with the structuring and development of a comprehensive executive compensation program based on performance, utilizing the elements discussed below.
17
We first engaged the firm of Frederic W. The committee continued to consult with FW Cook & Co.on executive compensation matters in 2015 to provide assistance with the development of executive incentive plans.2017 through 2019. We considered all factors relevant to Frederic W. Cook & Co.’sFW Cook’s independence from management, including but not limited to the following factors:
Name |
| 2017 Base Salary |
| Percentage Increase (Decrease) Over 2016 | ||
Sven-Olof Lindblad |
| $ | 500,000 |
| (26 | )% |
Ian T. Rogers |
| $ | 450,000 |
| — | % |
Craig I. Felenstein |
| $ | 400,000 |
| — | % |
Dean (Trey) Byus III |
| $ | 275,000 |
| 21 | % |
Philip J. Auerbach |
| $ | 400,000 |
| — | % |
In 2017, Mr. Lindblad voluntarily agreed
| Name | | | Fiscal 2020 Base Salary | | | Percentage Increase Over Fiscal 2019 Base Salary | | ||||||
| Sven-Olof Lindblad | | | | $ | 530,450(a) | | | | | | 3% | | |
| Craig I. Felenstein | | | | $ | 424,360(a) | | | | | | 3% | | |
| Philip J. Auerbach | | | | $ | 424,360(a) | | | | | | 3% | | |
| Dean (Trey) Byus III | | | | $ | 350,000(a) | | | | | | 24% | | |
| Benjamin L. Bressler | | | | $ | 200,000(b) | | | | | | 0% | | |
restricted stock unit and performance stock unit grants to Messrs. Lindblad, Felenstein Auerbach and Byus, have been deferred until such time as the compensation committee determines that the earned cash bonuses shall be paid, salary increases shall be granted and remaining long-term incentive compensation shall be awarded.
2016 Short-Term (Annual) Incentive Compensation
Due to the timing of our merger and transition into a public company, our compensation committee did not establish fixed performance parameters for our NEOs for fiscal 2016. Accordingly, the bonuses awarded to our NEOs were based on existing contractual requirements (as described below) or discretionary awards not tied to any specific
18
financial and non-financial objectives. The determination of the bonus payments was based on our compensation committee’s evaluation of the individual executive officer’s performance, as well as an assessment of past and future performance, including, but not limited to, subjective assessments of our operational performance during the year and position for the achievement of acceptable financial performance in the subsequent year.
As described below with respect to 2017 compensation, in the future, our compensation committee, subject to any applicable employment agreements, will determine performance parameters and bonus opportunities for appropriate executives annually. At the end of each year, the Board and compensation committee will determine the level of achievement for each corporate goal.
The fiscal 2016 discretionary cash bonuses approved by our compensation committee for our NEOs were as follows:
Name |
| Fiscal 2016 | |
Sven-Olof Lindblad |
| $ | 500,000 |
Ian T. Rogers |
| $ | 506,250 |
Craig I. Felenstein |
| $ | 200,000 |
Dean (Trey) Byus III |
| $ | 256,321 |
Philip J. Auerbach |
| $ | 200,000 |
2017 Short-Term (Annual) Incentive Compensation
In March 2017, our compensation committee adopted an Employee Incentive Plan (EIP) under our 2015 Long-Term Incentive Plan to govern annual cash incentive award opportunities for our executive officers and other key employees. Target award levels under the EIP are based on a percentage of each participant’s base salary and cash incentive awards are earned based on performance against metrics, which, for 2017, will be based on ourmetrics.
For 2017, The compensation committee set target award levels for each of our NEOs were set at the following maximum levelsa target level of 75% (as a percentage of base salary) by a subcommittee of our compensation committee: Mr. Lindblad: 75%; Mr. Felenstein: 75%; Mr. Rogers: 75%; Mr. Auerbach: 75%; and Mr. Byus: 75%. For 2017,2019, awards maycould be earned at a level of up to 150% of the target level if maximum performance goals are achieved. Final payouts for 2017 will be determined by our compensation committee (or a subcommittee thereof) in early 2018.achieved and the minimum thresholds to earn awards were as follows: Adjusted EBITDA (85% of target), Net Yield (90% of target) and Guest Satisfaction (96% of target). Our compensation committee has the discretion to adjust the achievement of the financial metrics for unusual and nonrecurring factors and events, such as acquisitions and other unusual events, costs and expenses.
For 2019, our NEOs earned 96.5% of the target award level for the short-term incentive compensation resulting in the following bonus amounts:
| Name | | | 2019 Short-Term Annual Cash-Based Incentive Bonus Amount(a) | | |||
| Mr. Lindblad | | | | $ | 372,731 | | |
| Mr. Felenstein | | | | $ | 298,185 | | |
| Mr. Auerbach | | | | $ | 298,185 | | |
| Mr. Byus III | | | | $ | 205,003 | | |
2016 Long-Term Incentive Compensation.
In connection with the Lindblad merger, options to purchase shares of Lindblad’s Class A common stock held by Messrs. Rogers and Byus were converted into options to purchase shares of our common stock. The options were originally scheduled to vest in three equal annual installments following the date of grant and were adjusted in connection with the merger, with respect to vesting and exercisability, such that the converted options vested (or will vest) and become exercisable as follows (subject to the executive’s continued employment through the applicable vesting date):
• 33.3% of the options vested on the one-month anniversary of the closing date of the merger and have been exercised by each of the executive officers.
• 16.7% of the options vested on January 1, 2016 and have been exercised by each of the executive officers.
19
• 25% of the options vested on December 31, 2016 and will expire on December 31, 2017 if not exercised on or before that date.
• 25% of the options will vest on December 31, 2017 and will expire on December 31, 2018 if not exercised on or before that date.
In light of the equity awards to Messrs. Rogers and Byus in connection with the merger and Mr. Lindblad’s equity position in our company, our compensation committee did not make any equity awards to such executives in 2016.
In connection with the appointment of Mr. Skarda in January 2016, our compensation committee approved a grant of stock options to purchase 20,000 shares of our common stock vesting annually pro rata over a four-year period at an exercise price of $11.26 per share. In connection with the appointment of Mr. Auerbach in May 2016, our compensation committee approved a grant of 90,000 restricted shares of our common stock, vesting annually pro rata over a four-year period. In connection with the appointment of Mr. Felenstein in September 2016, our compensation committee approved (i) a grant of 40,000 restricted shares of our common stock vesting annually pro rata over a four-year period and (ii) a grant of stock options to purchase 200,000 shares of our common stock vesting annually pro rata over a four-year period at an exercise price of $9.47 per share.
2017 Long-Term Incentive Compensation.
In March 2017, our compensation committee (or a subcommittee thereof) approved awards of restricted stock units (“RSUs”) and performance share units (“PSUs”) to key employees, including our named executive officers, under our 2015 Long-Term Incentive Plan, each as described in more detail below:
$141,625.
$141,625.
Appointment of New Named Executive Officers
The compensation packages below for our newly appointednamed executive officers were determined by our compensation committee comparing competitive levels for similar positions in our industry and by considering the executive’s prior compensation arrangements, as well as through negotiations with the applicable executive.
20
Craig I. Felenstein. Effective September 6, 2016, we appointed Craig I. Felenstein as our new Chief Financial Officer. In connection withother than Mr. Felenstein’s appointment, we entered intoLindblad has an employment agreement that provides for severance in the event they are terminated without cause or they leave for good reason. We believe these agreements are important for retention purposes, as many companies we compete with Mr. Felenstein (as described below), pursuant to which he was provided with the followingoffer severance compensation, arrangements: (i) an initial annual base salary of $400,000; (ii) an annual bonus opportunity through an incentive bonus program established by our Board of Directors or our compensation committee, with bonuses to be targeted at 75% of annual base salary; (iii) an annual equity incentive award to be targeted at 100% of annual base salary, (iv) a grant of 40,000 restricted shares of our common stock vesting annually pro rata over a four-year period and (v) a grant of stock options to purchase 200,000 shares of our common stock vesting annually pro rata over a four-year period.
Philip J. Auerbach. Effective May 26, 2016, we appointed Philip J. Auerbach as our new Chief Commercial Officer. Inparticularly in connection with a change of control. Accordingly, our named executive officers other than Mr. Auerbach’s appointment, we entered into an employmentLindblad have the right to receive severance compensation if they are terminated without cause or they leave for good reason while the agreement with Mr. Auerbach (as described below), pursuant to which he was provided with the following compensation arrangements: (i) an initial annual base salary of $400,000; (ii) a one-time signing bonus of $125,000 (a portion of which was intended to cover relocation expenses), provided, however, that if Mr. Auerbach’s employment with us is terminated for “cause” or due to his resignation without “good reason” during the first year of employment, he must repay the full amount of the signing bonus to us and ifin effect. If such termination occurs duringwithin a specified period after a change of control, enhanced severance compensation, including the second yearvesting of unvested equity awards, is provided. We believe that such compensation gives our named executive officers incentive (1) to stay with the Company despite the possibility of losing employment after a change of control and (2) to focus on obtaining the best possible value for stockholders in a change of control transaction. For additional information
result of misconduct, with any financial reporting requirement under securities laws.
Name and Principal Position |
| Year |
| Salary |
| Bonus |
| Stock |
| Option |
| All Other Compensation(3) |
| Total | |||||||||
Sven-Olof Lindblad |
| 2016 |
| $ | 674,918 |
| $ | 500,000 |
|
| $ | — |
|
| $ | — |
|
| $ | 91,042 |
| $ | 1,265,960 |
President and Chief Executive Officer |
| 2015 |
| $ | 668,429 |
| $ | 5,506,187 | (4) |
| $ | — |
|
| $ | — |
|
| $ | 20,305 |
| $ | 6,194,921 |
|
| 2014 |
| $ | 648,960 |
| $ | 2,050,000 |
|
| $ | — |
|
| $ | — |
|
| $ | 24,589 |
| $ | 2,723,549 |
|
|
|
|
|
|
|
|
|
|
|
|
|
|
|
|
|
|
|
|
|
|
|
|
Ian T. Rogers |
| 2016 |
| $ | 449,946 |
| $ | 506,250 |
|
| $ | — |
|
| $ | — |
|
| $ | 127,295 |
| $ | 1,083,491 |
Chief Operating Officer, Vice President |
| 2015 |
| $ | 445,620 |
| $ | 3,179,734 | (5) |
| $ | — |
|
| $ | — |
|
| $ | 68,892 |
| $ | 3,694,246 |
and Treasurer |
| 2014 |
| $ | 432,640 |
| $ | 1,210,000 |
|
| $ | — |
|
| $ | 10,923,501 |
|
| $ | 24,589 |
| $ | 12,590,730 |
|
|
|
|
|
|
|
|
|
|
|
|
|
|
|
|
|
|
|
|
|
|
|
|
Craig I. Felenstein |
| 2016 |
| $ | 128,975 |
| $ | 200,000 |
|
| $ | 378,800 | (7) |
| $ | 978,000 | (8) |
| $ | 4,251 |
| $ | 1,690,026 |
Chief Financial Officer |
|
|
|
|
|
|
|
|
|
|
|
|
|
|
|
|
|
|
|
|
|
|
|
|
|
|
|
|
|
|
|
|
|
|
|
|
|
|
|
|
|
|
|
|
|
|
|
John T. McClain(1) |
| 2016 |
| $ | 300,746 |
| $ | 250,000 |
|
| $ | — |
|
| $ | — |
|
| $ | 18,003 |
| $ | 568,749 |
Former Chief Financial Officer |
| 2015 |
| $ | 59,664 |
| $ | 59,488 |
|
| $ | — |
|
| $ | 1,662,000 |
|
| $ | — |
| $ | 1,781,152 |
|
|
|
|
|
|
|
|
|
|
|
|
|
|
|
|
|
|
|
|
|
|
|
|
Dean (Trey) Byus III |
| 2016 |
| $ | 227,841 |
| $ | 256,321 |
|
| $ | — |
|
| $ | — |
|
| $ | 27,030 |
| $ | 511,195 |
Chief Expedition Officer |
| 2015 |
| $ | 225,650 |
| $ | 2,208,688 | (6) |
| $ | — |
|
| $ | — |
|
| $ | 26,642 |
| $ | 2,460,980 |
|
| 2014 |
| $ | 219,078 |
| $ | 470,000 |
|
| $ | — |
|
| $ | 3,641,167 |
|
| $ | 24,589 |
| $ | 4,354,834 |
|
|
|
|
|
|
|
|
|
|
|
|
|
|
|
|
|
|
|
|
|
|
|
|
Philip J. Auerbach |
| 2016 |
| $ | 239,488 |
| $ | 325,000 |
|
| $ | 909,000 | (7) |
| $ | — |
|
| $ | 10,417 |
| $ | 1,483,905 |
Chief Commercial Officer |
|
|
|
|
|
|
|
|
|
|
|
|
|
|
|
|
|
|
|
|
|
|
|
____________
| Name and Principal Position | | | Year | | | Salary | | | Bonus(1) | | | Stock(2) | | | Option | | | All Other(3) | | | Total | | |||||||||||||||||||||
Sven-Olof Lindblad President and Chief Executive Officer | | | | | 2019 | | | | | $ | 515,000 | | | | | $ | 370,017 | | | | | $ | 772,504 | | | | | $ | 0 | | | | | $ | 31,127 | | | | | $ | 1,688,648 | | |
| | | | 2018 | | | | | $ | 500,000 | | | | | $ | 378,750 | | | | | $ | 749,998 | | | | | $ | 0 | | | | | $ | 29,110 | | | | | $ | 1,657,858 | | | ||
| | | | 2017 | | | | | $ | 543,726 | | | | | $ | 242,368 | | | | | $ | 751,680 | | | | | $ | 0 | | | | | $ | 29,110 | | | | | $ | 1,556,884 | | | ||
Craig I. Felenstein Chief Financial Officer | | | | | 2019 | | | | | $ | 412,000 | | | | | $ | 296,014 | | | | | $ | 411,994 | | | | | $ | 0 | | | | | $ | 31,739 | | | | | $ | 1,151,747 | | |
| | | | 2018 | | | | | $ | 400,000 | | | | | $ | 353,000 | | | | | $ | 399,996 | | | | | $ | 0 | | | | | $ | 29,719 | | | | | $ | 1,182,718 | | | ||
| | | | 2017 | | | | | $ | 400,000 | | | | | $ | 196,693 | | | | | $ | 400,885 | | | | | $ | 0 | | | | | $ | 29,719 | | | | | $ | 1,027,297 | | | ||
Philip J. Auerbach Chief Commercial Officer | | | | | 2019 | | | | | $ | 412,000 | | | | | $ | 296,014 | | | | | $ | 411,994 | | | | | $ | 0 | | | | | $ | 31,174 | | | | | $ | 1,151,182 | | |
| | | | 2018 | | | | | $ | 400,000 | | | | | $ | 303,000 | | | | | $ | 399,996 | | | | | $ | 0 | | | | | $ | 29,719 | | | | | $ | 1,132,193 | | | ||
| | | | 2017 | | | | | $ | 400,000 | | | | | $ | 196,693 | | | | | $ | 400,885 | | | | | $ | 0 | | | | | $ | 29,197 | | | | | $ | 1,026,775 | | | ||
Dean (Trey) Byus III Chief Expedition Officer | | | | | 2019 | | | | | $ | 283,250 | | | | | $ | 203,510 | | | | | $ | 283,254 | | | | | $ | 0 | | | | | $ | 31,739 | | | | | $ | 801,753 | | |
| | | | 2018 | | | | | $ | 275,000 | | | | | $ | 208,557 | | | | | $ | 275,010 | | | | | $ | 0 | | | | | $ | 29,719 | | | | | $ | 788,286 | | | ||
| | | | 2017 | | | | | $ | 261,245 | | | | | $ | 128,463 | | | | | $ | 275,641 | | | | | $ | 0 | | | | | $ | 29,719 | | | | | $ | 695,041 | | | ||
Benjamin L. Bressler President, Natural Habitat, Inc. | | | | | 2019 | | | | | $ | 200,000 | | | | | $ | 841,073 | | | | | $ | 0 | | | | | $ | 0 | | | | | $ | 39,617 | | | | | $ | 1,080,690 | | |
| | | | 2018 | | | | | $ | 200,000 | | | | | $ | 562,557 | | | | | $ | 0 | | | | | $ | 0 | | | | | $ | 37,579 | | | | | $ | 800,154 | | | ||
| | | | 2017 | | | | | $ | 200,000 | | | | | $ | 429,845 | | | | | $ | 0 | | | | | $ | 0 | | | | | $ | 37,579 | | | | | $ | 667,444 | | | ||
(2) grant. Refer to Note 12 of our consolidated financial statements included in our Annual Report on Form 10-K for the year ended December 31, 2019.
| Name | | | 401(k) Match | | | Health Insurance Premiums | | | Life, Accidental, Death and Dismemberment and Long-term Disability Premiums | | | Other | | ||||||||||||
| Mr. Lindblad | | | | $ | 2,400 | | | | | $ | 26,849 | | | | | $ | 1,878 | | | | | $ | — | | |
| Mr. Felenstein | | | | $ | 2,400 | | | | | $ | 26,849 | | | | | $ | 2,490 | | | | | $ | — | | |
| Mr. Auerbach | | | | $ | 2,357 | | | | | $ | 26,849 | | | | | $ | 1,968 | | | | | $ | — | | |
| Mr. Byus | | | | $ | 2,400 | | | | | $ | 26,849 | | | | | $ | 2,490 | | | | | $ | — | | |
| Mr. Bressler | | | | $ | 2,400 | | | | | $ | 26,849 | | | | | $ | 1,968 | | | | | $ | 8,400(a) | | |
| Name | | | Grant Date of Equity Incentive Plan Awards | | | Estimated Possible Payouts Under Non-Equity Incentive Plan Awards(1) | | | Estimated Future Payouts Under Equity Incentive Plan Awards(2) | | | All Other Stock Awards: Number of Shares of Stock or Units (#)(3) | | | Grant Date Fair Value of Stock and Option Awards(4) ($) | | |||||||||||||||||||||||||||||||||||||||
| | Threshold ($) | | | Target ($) | | | Maximum ($) | | | Threshold (#) | | | Target (#) | | | Maximum (#) | | ||||||||||||||||||||||||||||||||||||||
| Mr. Lindblad | | | | | | | | | | $ | 337,583 | | | | | $ | 386,250 | | | | | $ | 579,375 | | | | | | | | | | | | | | | | | | | | | | | | | | | | | | | | |
| | | | | | 3/29/2019 | | | | | | | | | | | | | | | | | | | | | | | | — | | | | | | 25,328 | | | | | | 50,656 | | | | | | | | | | | $ | 386,252 | | |
| | | | | | 3/29/2019 | | | | | | | | | | | | | | | | | | | | | | | | | | | | | | | | | | | | | | | | | | 25,328 | | | | | $ | 386,252 | | |
| Mr. Felenstein | | | | | | | | | | $ | 270,066 | | | | | $ | 309,000 | | | | | $ | 463,500 | | | | | | | | | | | | | | | | | | | | | | | | | | | | | | | | |
| | | | | | 3/29/2019 | | | | | | | | | | | | | | | | | | | | | | | | — | | | | | | 13,508 | | | | | | 27,016 | | | | | | | | | | | $ | 205,997 | | |
| | | | | | 3/29/2019 | | | | | | | | | | | | | | | | | | | | | | | | | | | | | | | | | | | | | | | | | | 13,508 | | | | | $ | 205,997 | | |
| Mr. Auerbach | | | | | | | | | | $ | 270,066 | | | | | $ | 309,000 | | | | | $ | 463,500 | | | | | | | | | | | | | | | | | | | | | | | | | | | | | | | | |
| | | | | | 3/29/2019 | | | | | | | | | | | | | | | | | | | | | | | | — | | | | | | 13,508 | | | | | | 27,016 | | | | | | | | | | | $ | 205,997 | | |
| | | | | | 3/29/2019 | | | | | | | | | | | | | | | | | | | | | | | | | | | | | | | | | | | | | | | | | | 13,508 | | | | | $ | 205,997 | | |
| Mr. Byus | | | | | | | | | | $ | 185,671 | | | | | $ | 212,438 | | | | | $ | 318,657 | | | | | | | | | | | | | | | | | | | | | | | | | | | | | | | | |
| | | | | | 3/29/2019 | | | | | | | | | | | | | | | | | | | | | | | | — | | | | | | 9,287 | | | | | | 18,574 | | | | | | | | | | | $ | 141,627 | | |
| | | | | | 3/29/2019 | | | | | | | | | | | | | | | | | | | | | | | | | | | | | | | | | | | | | | | | | | 9,287 | | | | | $ | 141,627 | | |
21
(3) The amounts in this column for 2016 consist of the following for each executive:
|
| 401(k) Match |
| Health |
| Life, Accidental |
| Housing Payment | ||||
Sven-Olof Lindblad |
| $ | 1,800 |
| $ | 23,960 |
| $ | 65,283 |
| $ | — |
Ian T. Rogers |
| $ | 1,800 |
| $ | 23,960 |
| $ | 1,270 |
| $ | 100,265 |
John T. McClain |
| $ | 1,800 |
| $ | 15,973 |
| $ | 230 |
|
| — |
Craig I Felenstein |
| $ | — |
| $ | 3,993 |
| $ | 258 |
| $ | — |
Philip J. Auerbach |
| $ | 116 |
| $ | 9,983 |
| $ | 318 |
| $ | — |
Dean (Trey) Byus III |
| $ | 1,800 |
| $ | 23,960 |
| $ | 1,270 |
| $ | — |
(4) Amount consists of a $5,000,000 success fee that was paid by DVB Bank America, N.V. and a discretionary bonus of $506,187.
(5) Amount consists of a one-time transaction bonus of $2,504,815 that was paid upon consummation of the merger with Lindblad and a discretionary bonus of $674,919.
(6) Amount consists of a one-time transaction bonus of $1,866,926 that was paid upon consummation of the merger with Lindblad and a discretionary bonus of $341,762.
(7) Amount consists of the fair value of restricted shares granted at the date of hire. Craig I. Felenstein received 40,000 shares with a grant price of $9.47 and Philip J. Auerbach received 90,000 shares with a grant price of $10.10 on September 6, 2016 and May 26, 2016, respectively.
(8) Amount consists of the fair value of 200,000 stock options granted to Craig I. Felenstein with a calculated fair value of $4.89 per option.
GRANTS OF PLAN BASED AWARDS DURING 2016
The following table sets forth information about grants of plan based awards to our NEOs during the year ended December 31, 2016.
Name |
| Grant Date |
| Date of Committee |
| All Other |
| All Other |
| Exercise Price |
| Grant Date | ||
Craig I. Felenstein |
| 09/06/16 |
| 07/18/16 |
| 40,000 |
| — |
|
| — |
| $ | 378,800 |
Craig I. Felenstein |
| 09/06/16 |
| 07/18/16 |
| — |
| 200,000 |
| $ | 9.47 |
| $ | 978,000 |
Philip J. Auerbach |
| 05/26/16 |
| 04/14/16 |
| 90,000 |
| — |
|
| — |
| $ | 909,000 |
____________
(1)Amount represents the aggregate grant date fair value computed in accordance with FASB ASC Topic 718. With respect to stock awards, the grant date fair value is measured based on the closing market value on the date of grant. The fair value of stock options are based on a Black-Scholes pricing model. Refer to Note 11 of our consolidated financial statements included in our Annual Report on Form 10-K for the year ended December 31, 2016.
22
|
| Stock Awards |
| Option Awards | ||||||||||
Name |
| Number of |
| Market |
| Number of |
| Number of |
| Option |
| Option | ||
Ian T. Rogers |
| — |
| — |
| 716,568 |
| 716,568 |
| $ | 1.76 |
| (3) |
|
Craig I. Felenstein |
| 40,000 |
| 378,000 |
| — |
| 200,000 |
| $ | 9.47 |
| 09/06/26(4) |
|
Dean (Trey) Byus III |
| — |
| — |
| 238,856 |
| 238,856 |
| $ | 1.76 |
| (3) |
|
Philip J. Auerbach |
| 90,000 |
| 850,500 |
| — |
| — |
| $ | — |
| N/A |
|
____________
| | | | Option Awards | | | Stock Awards | | ||||||||||||||||||||||||||||||||||||||||||
| Name | | | Number of Securities Underlying Unexercised Options Exercisable (#) | | | Number of Securities Underlying Unexercised Options Un-exercisable (#) | | | Option Exercise Price ($) | | | Option Expiration Date | | | Number of Shares or Units of Stock That Have Not Vested (#)(2) | | | Market Value of Shares or Units of Stock That Have Not Vested ($)(1) | | | Equity Incentive Plan Awards: Number of Unearned Shares, Units or Other Rights That Have Not Vested (#) | | | Equity Incentive Plan Awards: Market or Payout Value of Unearned Shares, Units or Other Rights That Have Not Vested ($)(1) | | ||||||||||||||||||||||||
| Mr. Lindblad | | | | | — | | | | | | — | | | | | | — | | | | | | — | | | | | | 63,622 | | | | | $ | 1,040,856 | | | | | | 32,461(3) | | | | | $ | 531,062 | | |
| | | | | | | | | | | | | | | | | | | | | | | | | | | | | | | | | | | | | | | | | | 36,514(4) | | | | | $ | 597,369 | | |
| | | | | | | | | | | | | | | | | | | | | | | | | | | | | | | | | | | | | | | | | | 25,328(5) | | | | | $ | 414,366 | | |
| Mr. Felenstein | | | | | 150,000 | | | | | | 50,000 | | | | | $ | 9.47 | | | | | | 9/6/26 | | | | | | 43,931 | | | | | $ | 718,711 | | | | | | 17,312(3) | | | | | $ | 283,224 | | |
| | | | | | | | | | | | | | | | | | | | | | | | | | | | | | | | | | | | | | | | | | 19,474(4) | | | | | $ | 318,595 | | |
| | | | | | | | | | | | | | | | | | | | | | | | | | | | | | | | | | | | | | | | | | 13,205(5) | | | | | $ | 220,991 | | |
| Mr. Auerbach | | | | | — | | | | | | — | | | | | | — | | | | | | — | | | | | | 56,431 | | | | | $ | 923,211 | | | | | | 17,312(3) | | | | | $ | 283,224 | | |
| | | | | | | | | | | | | | | | | | | | | | | | | | | | | | | | | | | | | | | | | | 19,474(4) | | | | | $ | 318,595 | | |
| | | | | | | | | | | | | | | | | | | | | | | | | | | | | | | | | | | | | | | | | | 13,205(5) | | | | | $ | 220,991 | | |
| Mr. Byus | | | | | — | | | | | | — | | | | | | — | | | | | | — | | | | | | 23,328 | | | | | $ | 381,646 | | | | | | 11,903(3) | | | | | $ | 194,733 | | |
| | | | | | | | | | | | | | | | | | | | | | | | | | | | | | | | | | | | | | | | | | 13,389(4) | | | | | $ | 219,044 | | |
| | | | | | | | | | | | | | | | | | | | | | | | | | | | | | | | | | | | | | | | | | 9,287(5) | | | | | $ | 151,935 | | |
(2)
(3)
| | Unvested Stock Awards | | | |||||||||||
| | Mr. Lindblad (#) | | | Mr. Felenstein (#) | | | Mr. Auerbach (#) | | | Mr. Byus (#) | | | Vesting Dates | |
| | 13,951 | | | 7,440 | | | 7,440 | | | 5,115 | | | Restricted Stock Unit awards vested on April 3, 2020. | |
| | 24,343 | | | 12,983 | | | 12,983 | | | 8,926 | | | Restricted Stock Unit awards vest 50% on March 30, 2020 and 2021. | |
| | 25,328 | | | 13,508 | | | 13,508 | | | 9,287 | | | Restricted Stock Unit awards vest 33% on March 31, 2020, 2021 and 2022. | |
| | N/A | | | 10,000 | | | N/A | | | N/A | | | Restricted Stock award vests on September 6, 2020. | |
| | N/A | | | N/A | | | 22,500 | | | N/A | | | Restricted Stock award vests on May 16, 2020. | |
(4) The options vest 25% per year2019 under our 2019 long-term incentive compensation plan based on the anniversary of the date of grant, subject to continued employment with us.
performance during 2019 through 2021. For additional information, see “Compensation Discussion and Analysis.”
2019
|
| Option Awards | |||
Name |
| Number of |
| Value Realized | |
Ian T. Rogers |
| 478,667 |
| $ | 4,245,776 |
Dean (Trey) Byus III |
| 159,556 |
| $ | 1,445,577 |
|
| 638,223 |
| $ | 5,691,354 |
____________
2019.
| | | | Option Awards | | | Stock Awards | | ||||||||||||||||||
| Name | | | Number of Shares Acquired on Exercise (#) | | | Value Realized on Exercise ($)(1) | | | Number of Shares Acquired on Vesting (#) | | | Value Realized on Vesting ($)(2) | | ||||||||||||
| Sven-Olof Lindblad | | | | | — | | | | | $ | — | | | | | | 26,122 | | | | | $ | 402,685 | | |
| Craig I. Felenstein | | | | | — | | | | | $ | — | | | | | | 23,932 | | | | | $ | 398,070 | | |
| Philip J. Auerbach | | | | | — | | | | | $ | — | | | | | | 36,432 | | | | | $ | 586,245 | | |
| Dean (Trey) Byus III | | | | | — | | | | | $ | — | | | | | | 9,579 | | | | | $ | 147,666 | | |
applicable vesting date or, if the market was closed on the vesting date, the last trading day that immediately preceded the vesting date.
23
later than 60 days before the end of the then-current term. Mr. Rogers’ initial annual base salary was $450,000 and Mr. Byus’ initial annual base salary was $219,078, each subject to periodic review and adjustment. Each executive will havenon-renewal; (ii) provides for an annual target cash bonus opportunity,equal to 75% of his base salary in 2018 (subject to
his base salary) and (iii) provides for participation in the Company’s equity incentive plans with the expectation that he will receive an annual equity award targeted at 100% of his base salary.
24
next
25
26
Name |
| Cash |
| Equity |
| Perquisites/ |
| Total | |||||||
Sven-Olof Lindblad |
| $ | — |
|
| $ | — |
|
| $ | — |
|
| $ | — |
Ian T. Rogers |
| $ | 1,053,279 | (1) |
| $ | 11,020,816 | (3) |
| $ | 23,960 | (5) |
| $ | 12,098,055 |
Craig I. Felenstein |
| $ | 200,000 | (2) |
| $ | 151,200 | (4) |
| $ | 11,980 | (6) |
| $ | 363,180 |
Philip J. Auerbach |
| $ | 200,000 | (2) |
| $ | 340,200 | (4) |
| $ | 11,980 | (6) |
| $ | 552,180 |
Dean (Trey) Byus III |
| $ | 529,016 | (1) |
| $ | 3,673,605 | (3) |
| $ | 23,960 | (5) |
| $ | 4,226,581 |
| Name | | | Cash | | | Equity | | | Perquisites/ Benefits | | | Total | | ||||||||||||
| Mr. Lindblad | | | | $ | — | | | | | $ | — | | | | | $ | — | | | | | $ | — | | |
| Mr. Felenstein | | | | $ | 708,014(1) | | | | | $ | 809,675(3) | | | | | $ | 33,084(5) | | | | | $ | 1,550,773 | | |
| Mr. Auerbach | | | | $ | 708,014(1) | | | | | $ | 923,211(4) | | | | | $ | 33,084(5) | | | | | $ | 1,664,309 | | |
| Mr. Byus | | | | $ | 675,864(2) | | | | | $ | — | | | | | $ | 33,084(5) | | | | | $ | 708,948 | | |
| Mr. Bressler | | | | $ | 7,190,604(10) | | | | | $ | — | | | | | $ | 49,626(11) | | | | | $ | 7,240,230 | | |
Name |
| Cash |
| Equity |
| Perquisites/ |
| Total | |||||||
Sven-Olof Lindblad |
| $ | — |
|
| $ | — |
|
| $ | — |
|
| $ | — |
Ian T. Rogers |
| $ | 1,575,000 | (7) |
| $ | 11,020,816 | (3) |
| $ | 47,919 | (8) |
| $ | 12,643,735 |
Craig I. Felenstein |
| $ | 200,000 | (2) |
| $ | 378,000 | (9) |
| $ | 11,980 | (6) |
| $ | 589,980 |
Philip J. Auerbach |
| $ | 200,000 | (2) |
| $ | 850,500 | (9) |
| $ | 11,980 | (6) |
| $ | 1,062,480 |
Dean (Trey) Byus III |
| $ | 797,444 | (7) |
| $ | 3,673,605 | (3) |
| $ | 47,919 | (8) |
| $ | 4,518,968 |
____________
| Name | | | Cash | | | Equity | | | Perquisites/ Benefits | | | Total | | ||||||||||||
| Mr. Lindblad | | | | $ | — | | | | | $ | — | | | | | $ | — | | | | | $ | — | | |
| Mr. Felenstein | | | | $ | 708,014(1) | | | | | $ | 1,063,211(7) | | | | | $ | 33,084(5) | | | | | $ | 1,804,309 | | |
| Mr. Auerbach | | | | $ | 708,014(1) | | | | | $ | 923,211(8) | | | | | $ | 33,084(5) | | | | | $ | 1,664,309 | | |
| Mr. Byus | | | | $ | 1,171,552(6) | | | | | $ | — | | | | | $ | 66,168(9) | | | | | $ | 1,237,720 | | |
| Mr. Bressler | | | | $ | 7,190,604(10) | | | | | $ | — | | | | | $ | 49,626(11) | | | | | $ | 7,240,230 | | |
(2) Amount represents six months of annual salary.
amount actually paid for the 2019 fiscal year.
options, plus (b) the market value of 65% of the unvested restricted shares and unvested RSUs at the December 31, 2019 closing share price of $16.36.
$16.36.
(7)
(8) (iii) Company Value Increase amount as defined per the employment acquisition agreement.
(9) Amount represents the market value of 100% of the unvested restricted shares at December 30, 2016 closing share price of $9.45. Craig I. Felenstein’s 200,000 options immediately vested at December 31, 2016 due to the change in control, but the market price at December 30, 2016 of $9.45 is less than the exercise price of $9.47, which results in an intrinsic value of less than zero. Therefore, there was no value associated with Mr. Felenstein’s options due to the change in control on December 31, 2016.
John T. McClain. On April 29, 2016, John T. McClain tendered his resignation as our Chief Financial Officer to pursue other business opportunities. On May 2, 2016, we entered into an amended and restated employment agreement with Mr. McClain, which provided that Mr. McClain would receive a guaranteed bonus payment of
27
$250,000 in 2016, to be paid in two installments of $75,000 and $175,000 on each of May 15, 2016 and August 15, 2016, respectively. These payments were contingent on Mr. McClain not being terminated for “cause” or resigning without “good reason” before the applicable payment date. Mr. McClain’s employment with us terminated on September 6, 2016 upon the appointment of our new Chief Financial Officer. Other than the guaranteed bonus payments, Mr. McClain did not receive any compensation upon the termination of his employment with us.
2019.
28
29
NEOs, including Mr. Lindblad, our Chief Executive Officer and President.
30
31
|
| 2016 |
| 2015 | ||
Audit fees(1) |
| $ | 354,661 |
| $ | 435,000 |
|
|
|
|
|
|
|
Audit-related fees(2) |
| $ | 34,170 |
| $ | 86,005 |
|
|
|
|
|
|
|
Tax fees |
| $ | — |
| $ | — |
|
|
|
|
|
|
|
All other fees |
| $ | — |
| $ | — |
____________
2018:
| | | | 2019 | | | 2018 | | ||||||
Audit fees(1) | | | | $ | 513,526 | | | | | $ | 537,660 | | |
| Audit-related fees | | | | $ | — | | | | | $ | –– | | |
| Tax fees | | | | $ | — | | | | | $ | — | | |
All other fees(2) | | | | $ | 42,863 | | | | | $ | — | | |
the Securities and Exchange Commission.
The audit committee has considered whether the provision of the services not related to the audit of the financial statements acknowledged in the table above was compatible with maintaining the independence of Marcum LLP’s and is of the opinion that the provision of these services was compatible with maintaining Marcum LLP’s independence.
32
2020.
33
![[MISSING IMAGE: tm2016651-1_pc1.jpg]](https://capedge.com/proxy/DEF 14A/0001104659-20-053333/tm2016651-1_pc1.jpg)
![[MISSING IMAGE: tm2016651-1_pc2.jpg]](https://capedge.com/proxy/DEF 14A/0001104659-20-053333/tm2016651-1_pc2.jpg)